


Dear WinkWorld Readers,
Recently, I posted a Steve Krashen (2005) article about what good writers (GWs) do, and what good academic writers (GAWs) do. This triggered a discussion with friend/colleague, Dr. Le Putney of UNLV, as she noted that Krashen says that GAWs begin with some type of display of data and end with the introduction. She has long believed this, and during the years, when some of her co-writers would be writing the initial introduction, she would dive into what she already knows (her data) and try to make some sense of what she has learned from the evidence already.
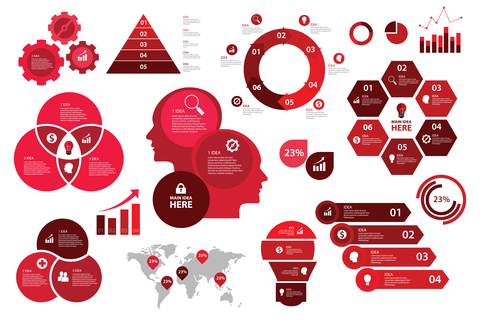
“I fuss with the data first,” Le says. Krashen says that this central table serves as a “center of gravity” for the study.
I have written with Le often through the years, and diving into the data is how we begin. For me, this usually involves a yellow legal pad, which I always considered my doodles: circles, arrows, images, numbers, etc. with words scribbled everywhere. When we finally can hold on to what we think we know, either with a display of data or doodles, then we can write.
If you can draw it, you can understand it, explain it, and write it.
However, when diving into the data, it often can feel like you are drowning under HEAPS of data. You have to keep digging to find the COMPLEXES of all of the possible relationships buried in the heaps of data before you can ever get to the CONCEPTS.
Eventually, we created our data table, which certainly has evolved into a center of gravity for various studies.
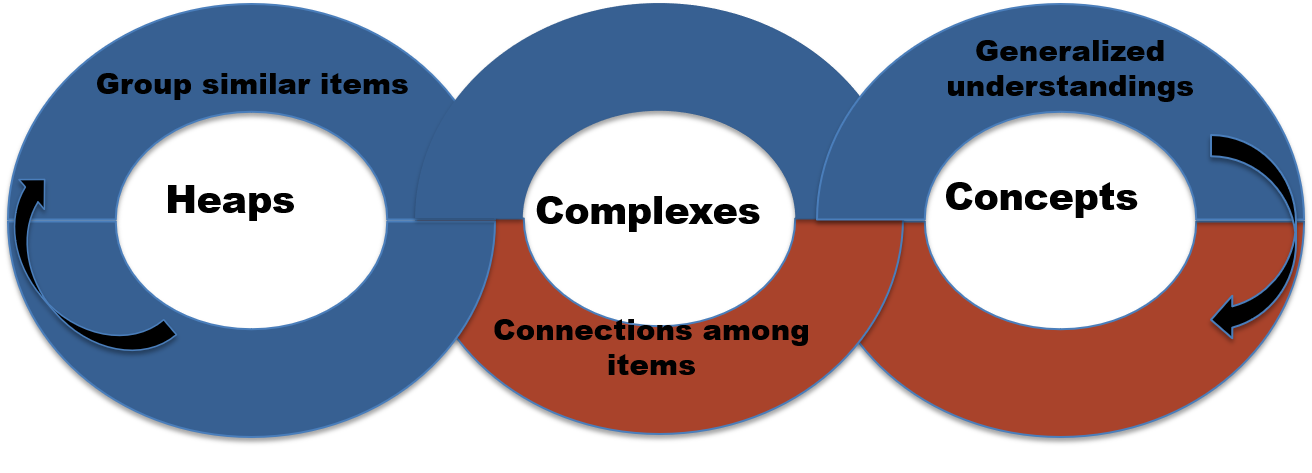
And, here is how we capture the circles with words.

Citations
Putney, L. G., Wink, J., & Perkins, P. (2006). Teachers as researchers: Using the Critical Action Research Matrix Application for Reflexive Classroom Inquiry. Florida Journal of Teacher Education, Vol . IX, pp. 23-35.
Display of data red image purchased from Dreamstime.
